We spend a lot of development time ensuring that our software is usable across all the commonly used web browsers. A disproportionate amount of this time is spent ensuring compliance with Microsoft’s archaic Internet Explorer 6 (IE6), which is 10 years old this year.
From time to time, we wonder whether we could provide better value for money by dropping support for IE6 and making more use of the facilities provided by newer browsers; a decision that has already been taken by the likes of YouTube, Facebook and Google.
Steph Gray recently blogged about whether Alphagov should have dropped IE6 support. Steph critiqued this decision, pointing out that a lot of civil servants still use IE6. We thought it might be useful to share the breakdown of browser usage by our civil service clients.
What do the numbers show?
Here is a chart of browser usage on the admin pages of our Citizen Space app, for the servers used by our Central Government clients:
And here is a graph of browser usage across all Citizen Space pages (admin and public-facing) on the same servers:
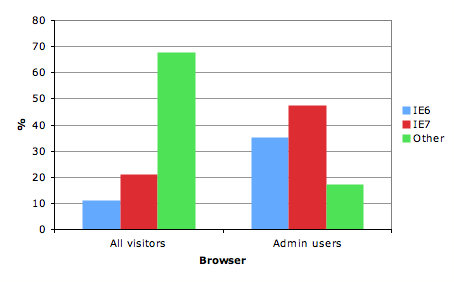
Here you can see that IE6 is used by more than a third of our Citizen Space administrators, but only about a tenth of the total visitors. At the moment, there is clearly a need to continue supporting IE6 for our clients, but it does seem a shame when this investment could be put towards improving the user experience of the site’s end users.
I could write more words about these differences, but here’s another chart that tells the story pretty clearly:
We’ll be keeping an eye on these figures to see how they change with time, and we’d also be interested to know how they compare with data from other sites aimed at government clients around the world. Does anyone else have any data they’d like to share?
The science bit:
- Data was taken from May 2011’s Apache access logs from one of our Citizen Space servers. Data is anonymised.
- We parsed the logs using the open-source Visitors software (which we modified to include the most recent versions of IE).
- Statistics are based on visits rather than pageviews, where a visit is all requests for a given useragent and IP address on one day.
- We excluded any visits from our own IP address and from our server monitoring services.
- We did not exclude crawlers and other bots, which probably account for the majority of the ‘unknown’ useragents in the second chart.


